Disease enrichment analysis
|
Gene-disease associations were derived for the curated gene-set based on statistically significant co-occurrences of genes and diseases in PubMed literature by using the G2SD tool. Diseases with P value < 0.05 were selected. The graphical output can be seen below: |
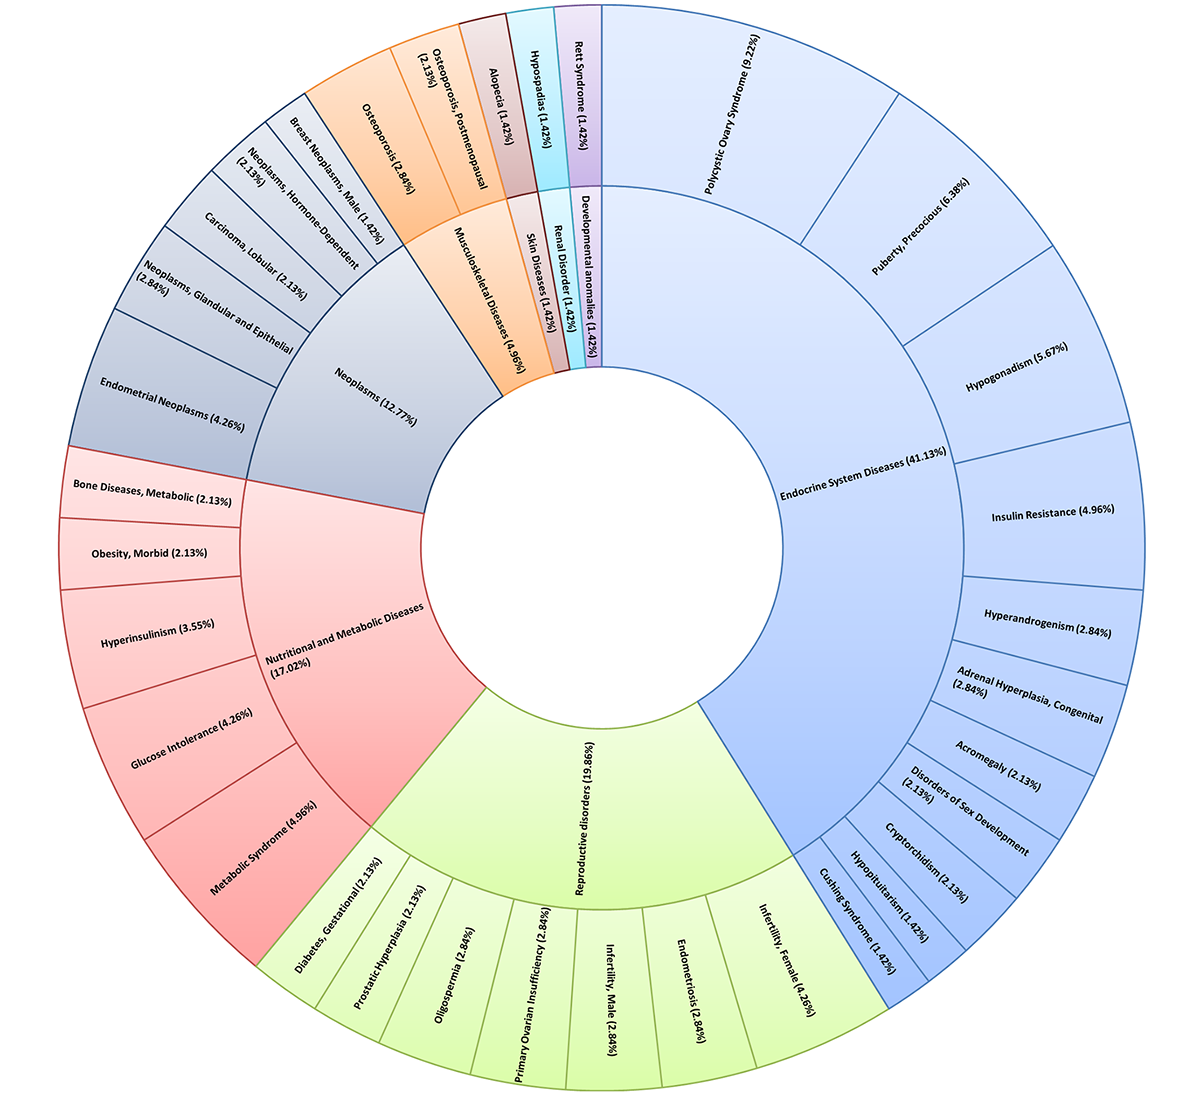
Multi-level pie chart illustrating percent distribution of enriched diseases obtained using PrecocityDB gene-set and GS2D. |
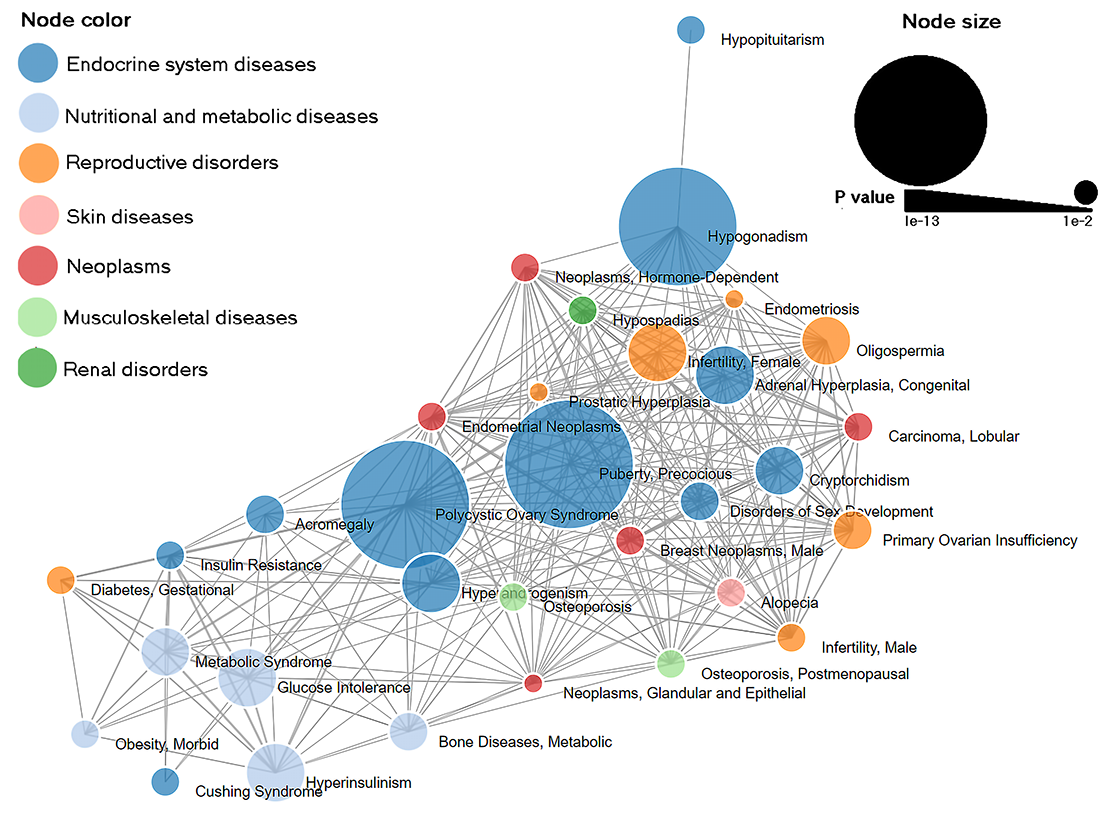 Disease-disease association network for PP. Edges represent at least one gene shared between two connecting nodes. Node color represents parent disease term and node size is proportional to P value of disease enrichment analysis. |
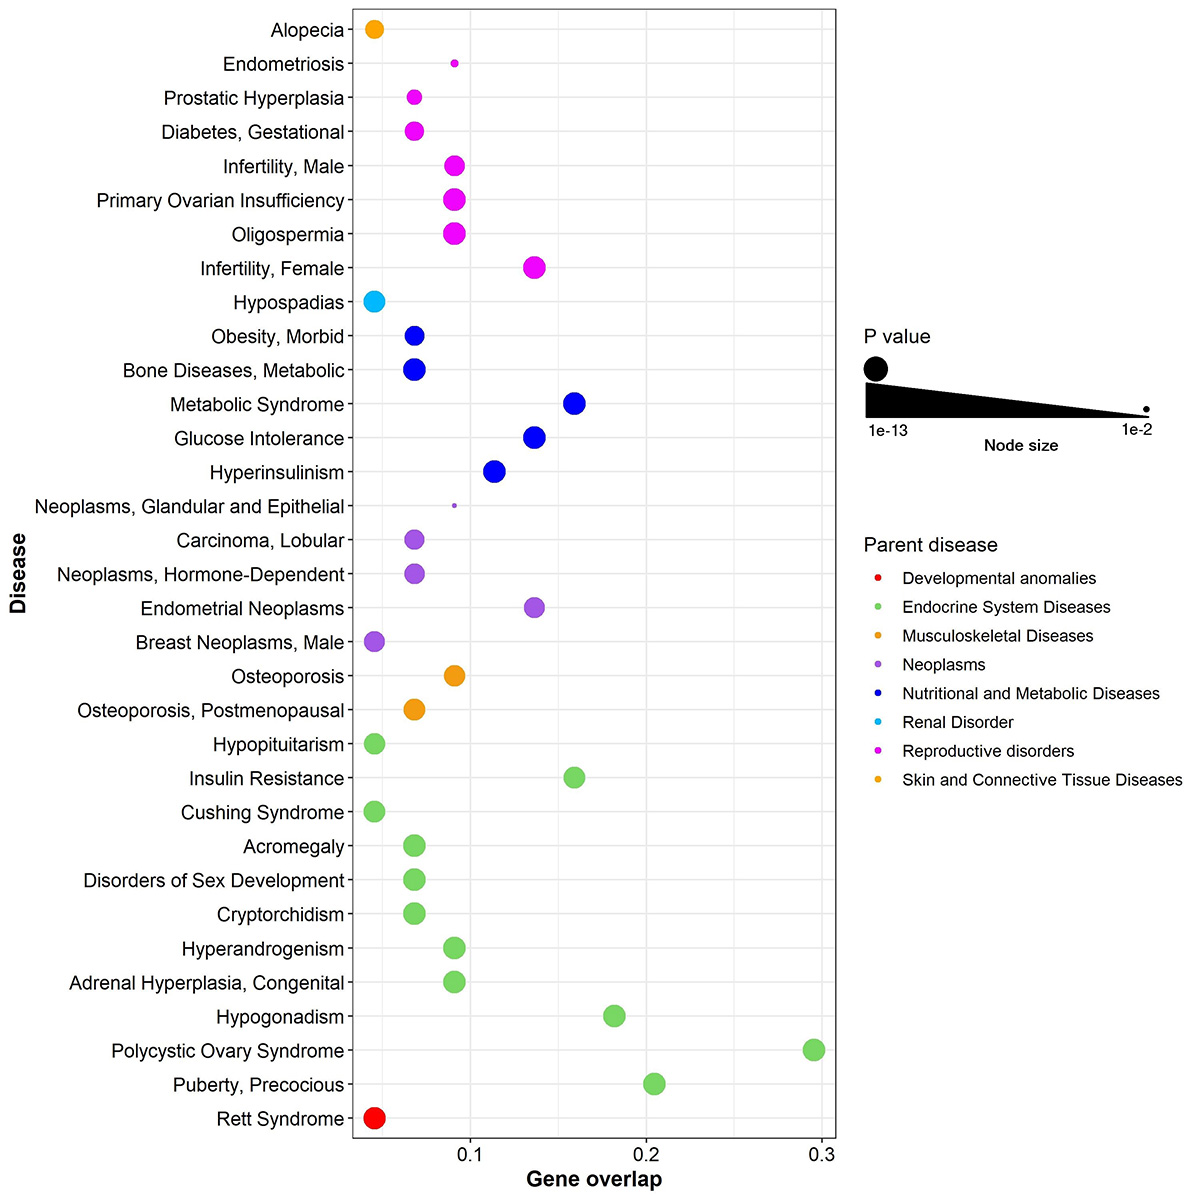
Bubble plot illustration of enriched diseases in PP. The x-axis represents gene overlap score (as given by GS2D) and y-axis indicates enriched disease terms. Bubble size is proportional to P value of enriched diseases. Bubble color represents parent disease term. |