Help
PrecocityDB is a comprehensive database dedicated to an endocrine disorder, Precocious Puberty (PP). The homepage provides a short description of the disease and database contents. The database has manually curated genes, SNPs associated with PP along with pathways and ontologies associated with these genes.
Data can be retrieved using the navigation tabs (menu bar) on the top of the webpage

Database statistics and our contact information is available on the bottom of the webpage

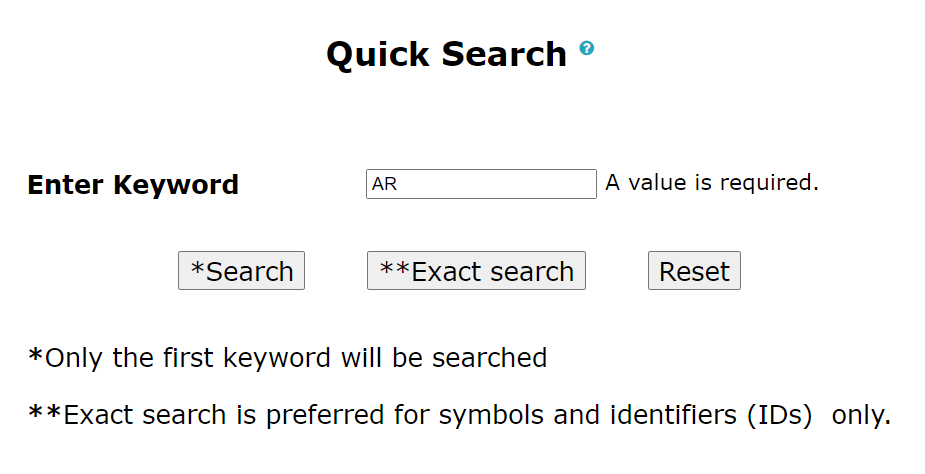
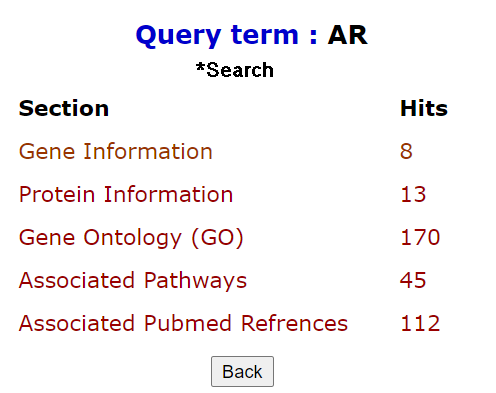
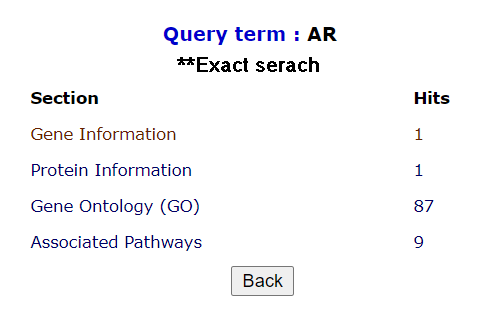
Quick search option in PrecocityDB allows users to query the whole database based on keywords. The number of hits, from each section of the database along with section name, is listed as a result. The results are hyperlinked to the detailed search result of the respective section.
There are two search options: 1. Search, 2. Exact search. Exact search matches the precise keyword, displays specific hits for any id or symbol.
Note: Only the first keyword will be considered for search if multiple keywords are given separated by space. Any other delimiter is invalid.
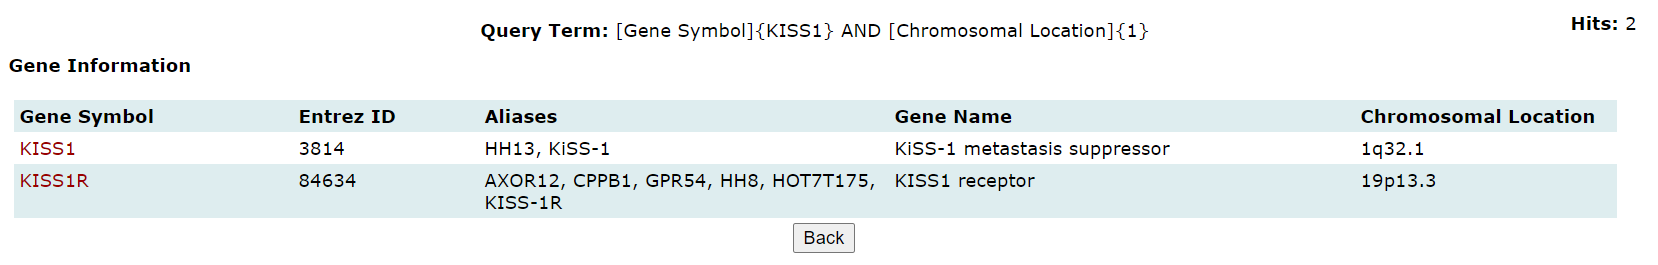
Advanced search in PrecocityDB allows users to search the database section-wise by selecting fields and applying logical operators (AND, OR, NOT).
Title |
Sub-headings |
Description |
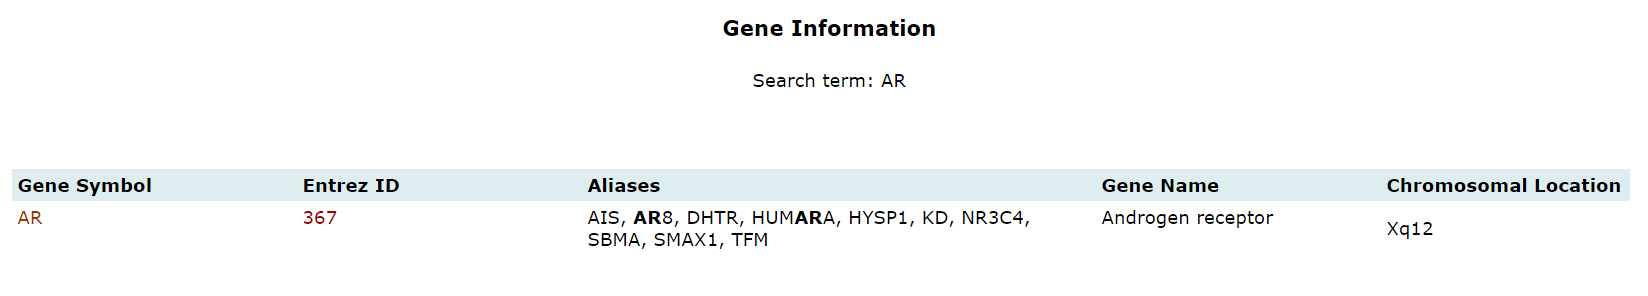
Gene Information |
Gene Symbol |
Unique gene symbol provided/ assigned by HUGO Gene Nomenclature Committee (HGNC) |
Aliases |
Synonyms or known terms for genes. These are unapproved nomenclature used in old literature. |
Entrez Gene ID |
A unique identification number assigned to every new gene record by NCBI |
Gene Name |
A unique name provided/ assigned by HUGO Gene Nomenclature Committee (HGNC) |
Chromosomal Location |
It provides information regarding the location of genes on a chromosome. |
Gene Summary |
It provides a short description of the gene from the NCBI Gene database. |
RefSeq DNA |
RefSeq DNA ID |
RefSeq mRNA |
RefSeq mRNA ID |
Gene Ontology |
Gene Symbol |
Symbol or aliases of the gene |
GO ID |
The Gene Ontology (GO) ID |
Ontology |
Biological domain with three aspects: Molecular function, Cellular components, and Biological processes. |
Function |
Sections under three main biological domains. |
Protein Information |
Protein Name |
It reports the name(s) assigned to the protein in NCBI |
Function |
A short description of the protein from UniProt. |
RefSeq Protein |
RefSeq Protein ID |
UniProt |
A unique accession number assigned to the product. A protein can have more than one accession number. |
RCSB PDB |
A unique identifier assigned to the new entry of a structure reported in Protein Data Bank (PDB) |
Associated Pathways |
Gene Symbol |
Symbol or aliases of the gene |
Pathway Name |
Name assigned to the process. |
Pathway ID |
A unique identifier assigned to a pathway in KEGG pathways and Reactome |
SNPs |
Gene Symbol |
Symbol or aliases of the gene |
SNP ID |
A unique identification code assigned to the mutation in the gene sequence. |
SNP |
Change in the nucleotide |
Reference |
Pubmed ID |
An identifier for published and freely- accessible articles |
Title |
Title of the article |
Author |
Author(s) of the article |
Abstract |
Abstract of the article |
Source |
The source of article |
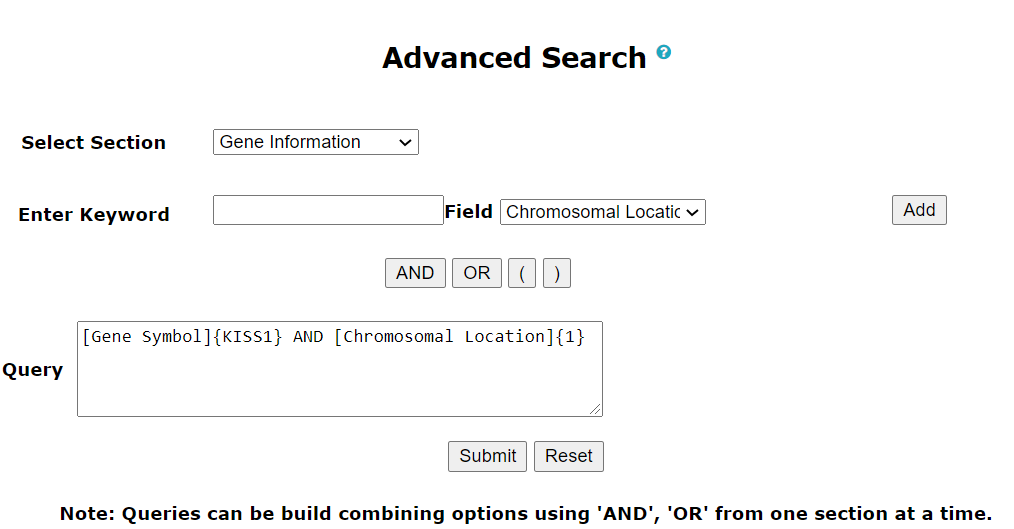
Note: Queries can be build combining options using 'AND', 'OR' from one section at a time.
Browse enables users to surf the database for genes, SNPs, pathways, and ontology associated with PP. The information available on each page is explained below:
Genes: The genes associated with PP can be browsed in the gene browse page. Links to complete information on manually curated genes are also provided and the rest are hyperlinked to respective NCBI page. Complete information on the manually curated genes has detailed information about protein, gene ontology, associated pathways, and associated literature references.
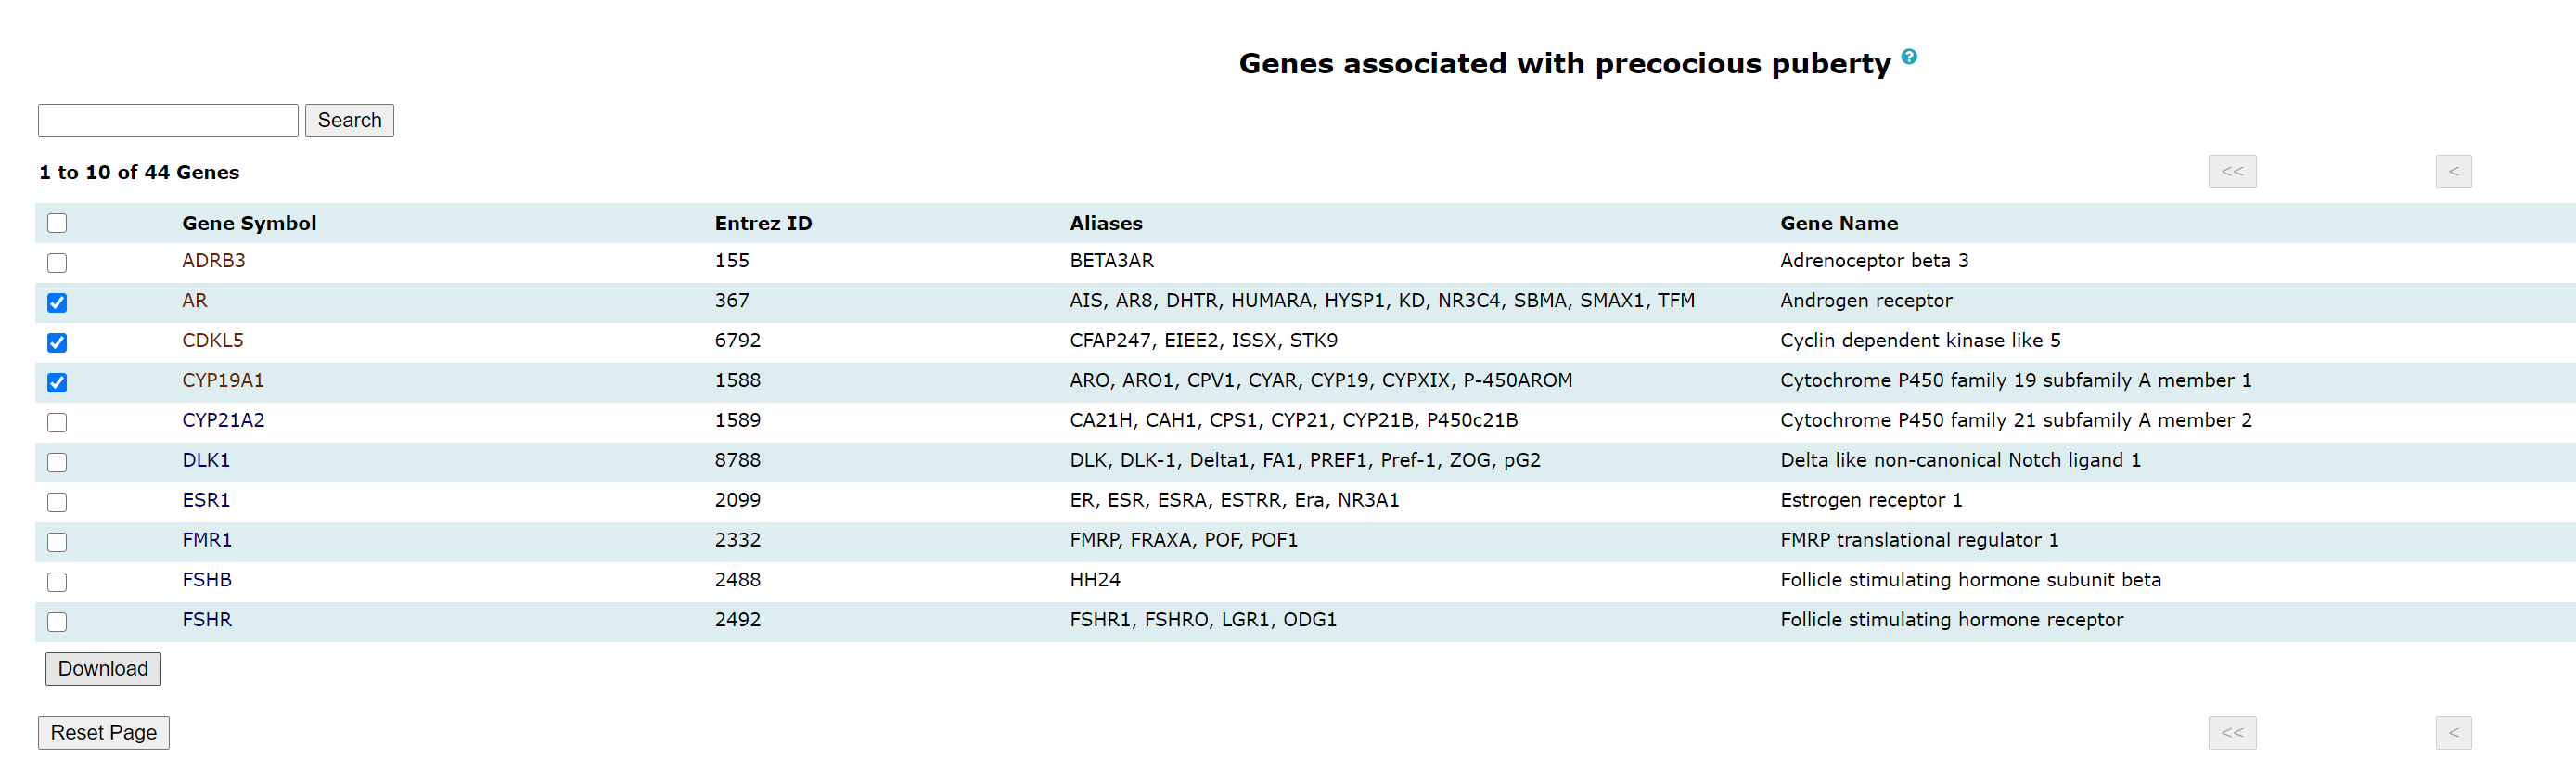
Meta-data of genes can be downloaded in a tab-separated file by selecting the checkboxes beside genes.
SNPs: This option lists all SNPs associated with PP, along with links to reference literature and the dbSNP database.
Pathways: The different metabolic/signaling pathways associated with genes in the database can be browsed. Links to the KEGG/Reactome pathway database is provided here.
Ontologies: The different ontology terms associated with genes in the database can be browsed here and ontologies are linked to GO page. Each ontology term is associated with many genes, and genes are also linked to pathways and diseases in the detailed information page of ontology.
All the above-mentioned pages can be filtered, queried using keywords, and browsed by alphabets. One or more of these can be clubbed to get more specific results.
- Chromosomal location of SNPs associated with precocious puberty
This tab allows to visualize chromosomal coordinates of SNPs associated with PP. Chromosomes are shown as vertical bars, wherein SNPs are marked in red. For details of a particular SNP, the chromosome can be selected and the SNP ID, chromosome number and nucleotide position can be seen by hovering over the red triangles.
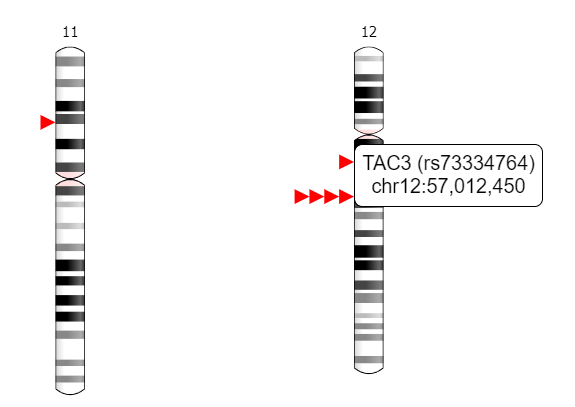
Multiple red triangles at a single location indicates presence of SNPs in less than 350000 nucleotide length.
This tab displays the result of pathway and disease enrichment analysis using the data available in PrecocityDB.
-
Pathway enrichment – Online available tool Enrichr was used to check significant overlap of PrecocityDb genes and their transcription factors with KEGG pathway’s gene sets. Pathways were ranked based on adjusted P value computed by Fisher’s exact test. Adjusted P value is calculated by first computing P value for many random input gene lists. This is then used as a lookup table of expected ranks with their variances. Adjusted P value denotes the independence for probability of PrecocityDb genes belonging to KEGG pathway’s gene sets, i.e pathways will be assigned lower P value when the combination of input gene overlapping with the pathway genes are not by chance or less random.
Enriched KEGG pathways were then mapped to their parent pathway groups using KEGG database. Cytoscape app ClueGO was used to cluster enriched pathways. The results were represented in 3 different types of plots 1. Multilayered pie (generated using Excel), 2. Bubble plot (generated in R; ggplot2 package ) and 3. Pathway network clusters ( ClueGO) .
-
Disease enrichment - A publically available web resource, Gene set to Diseases (GS2D) was used for performing disease enrichment. Similar to pathways, diseases were also ranked based on P value.
Enriched disease terms were mapped to single parent group based on a rule based method used in PCOSKB R2. The results were represented in 3 different types of plots 1. Multilayered pie (generated using Excel), 2. Bubble plot (generated in R; ggplot2 package) and 3. Disease networks (generated using D3 js).
|