Pathway enrichment analysis
Pathway enrichment analysis was performed on the manually curated gene-set and its transcription factors using Enrichr. The transcription factors of the gene-set were identified using TRRUST V2. KEGG database was used as pathway resource. Pathways with P value < 0.05 were selected. The pathways were clustered based on KEGG pathway terms using ClueGO. The graphical representations of the observations can be seen below: |
|
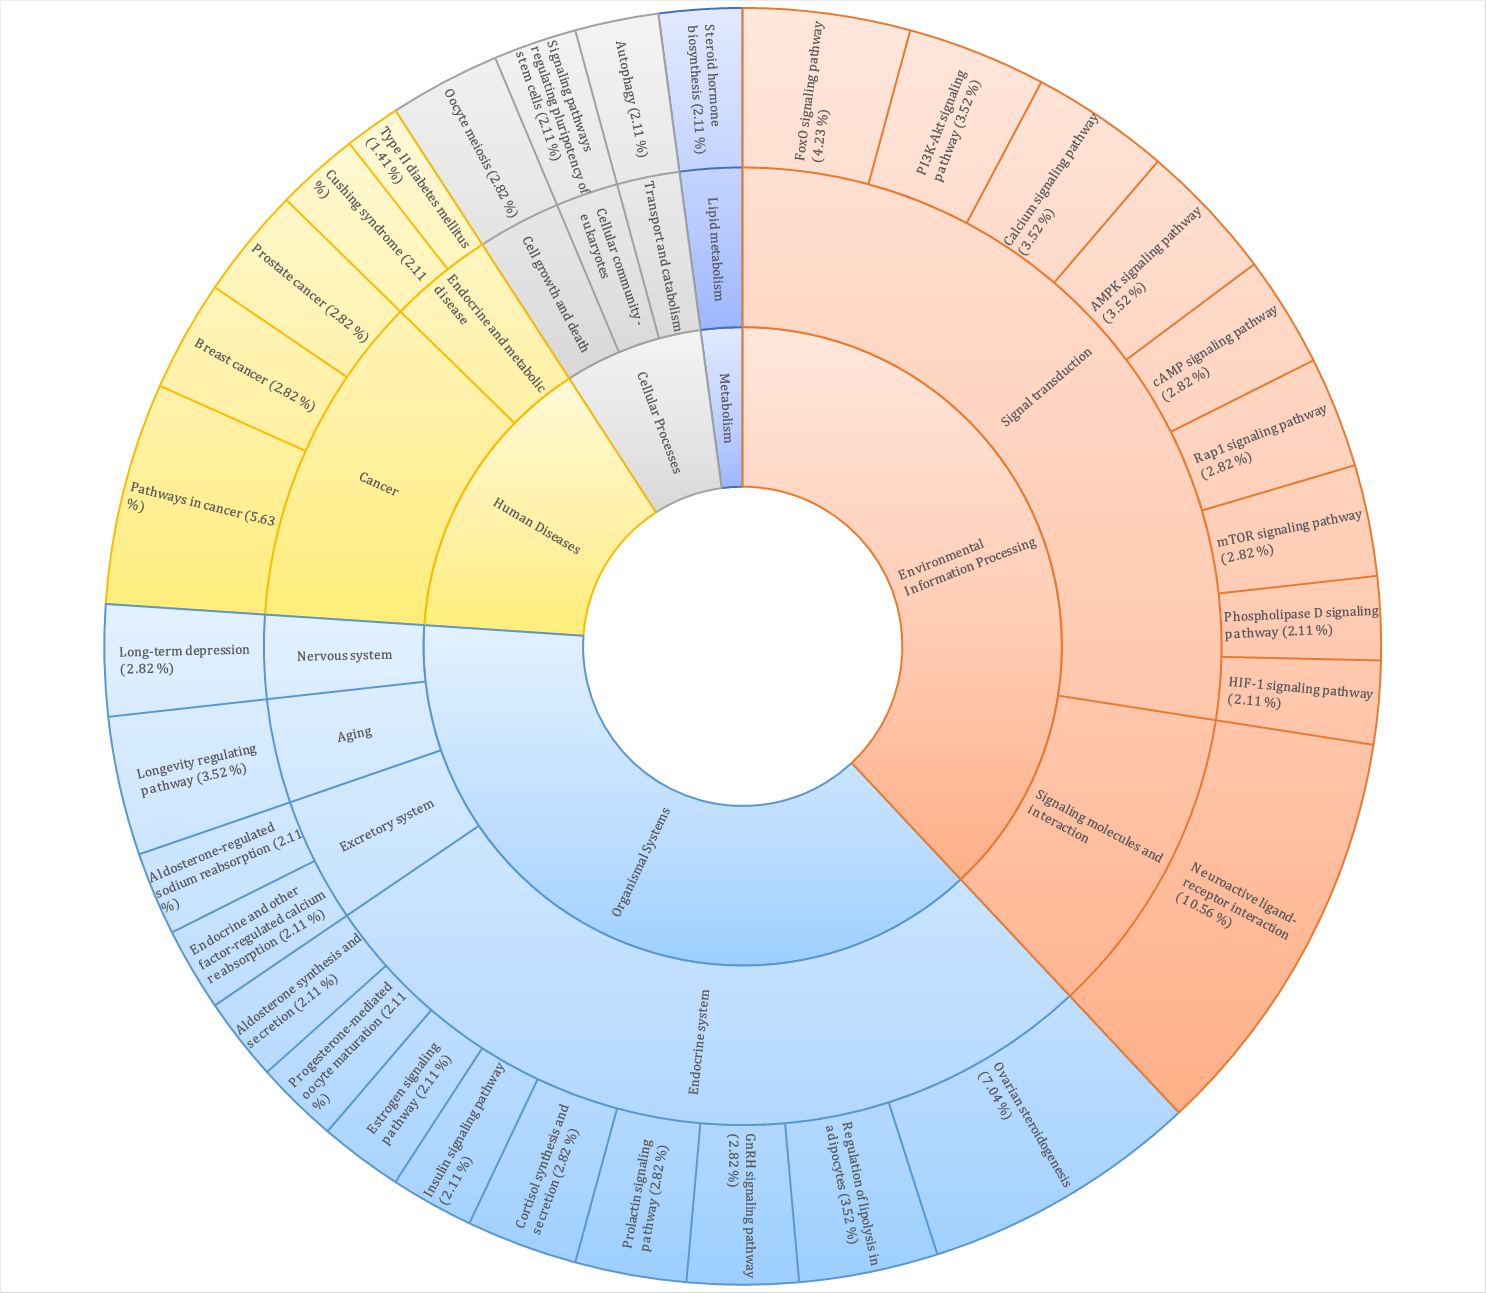
Multi-level pie chart illustrating percent distribution of enriched KEGG pathways along with its parent terms obtained using PrecocityDB gene-set. |
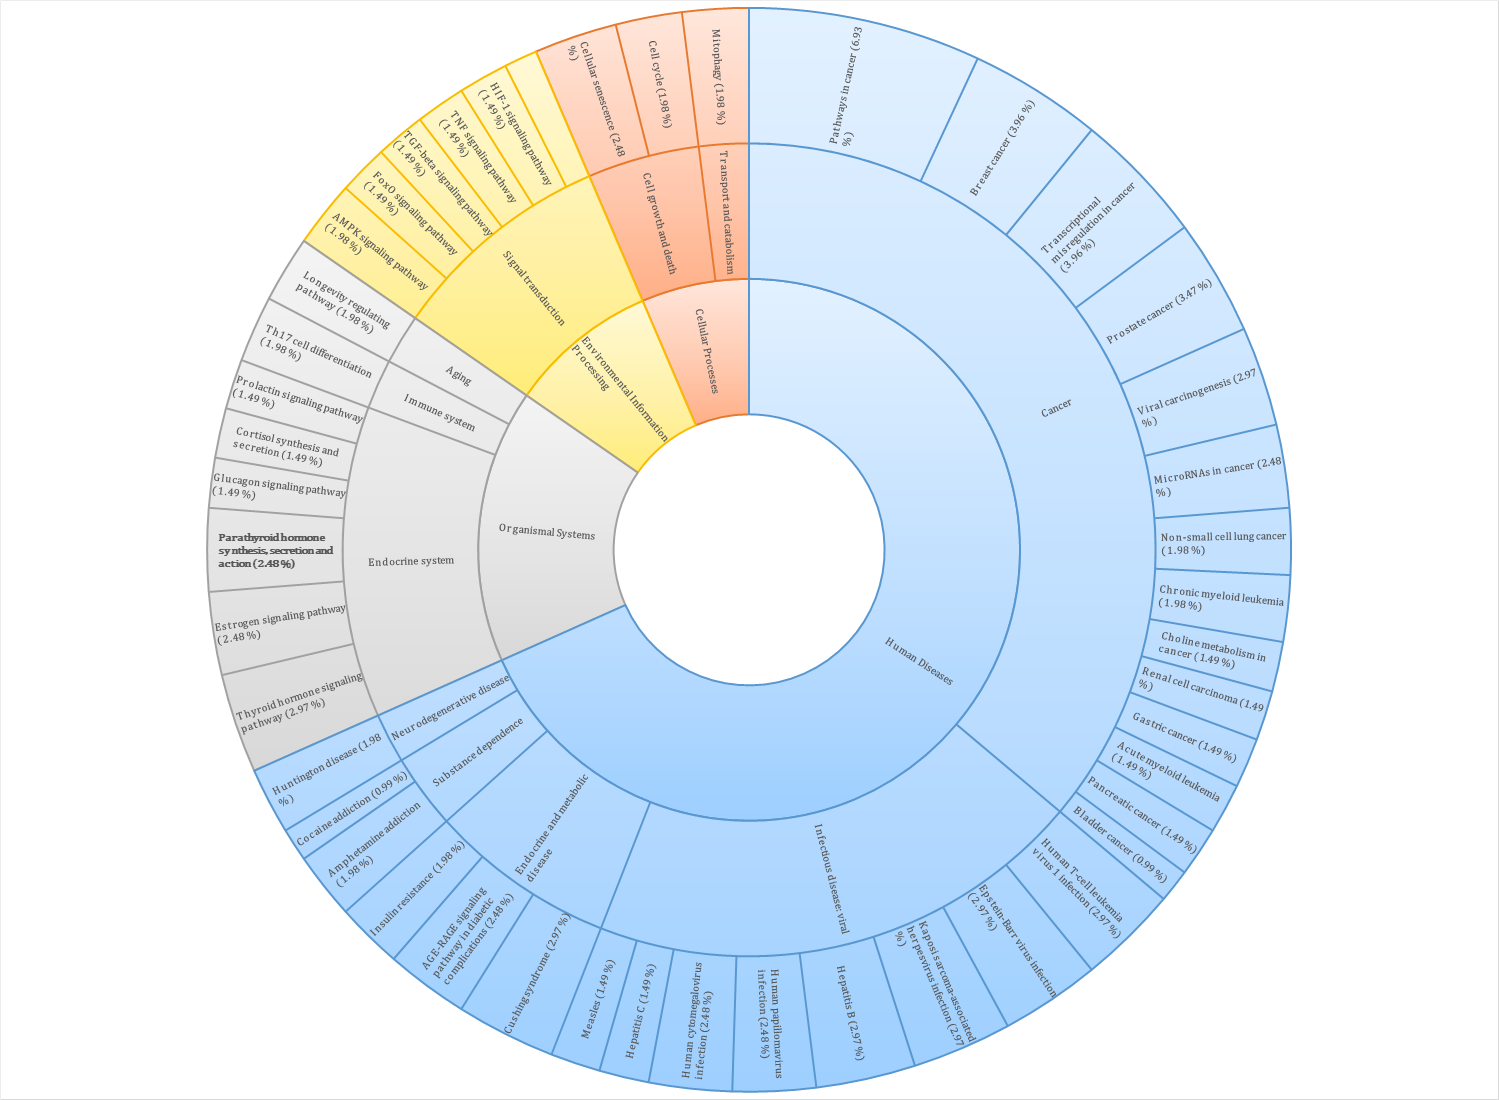 Multi-level pie chart illustrating percent distribution of enriched KEGG pathways along with its parent terms obtained using transcription factors of PrecocityDB gene-set. |
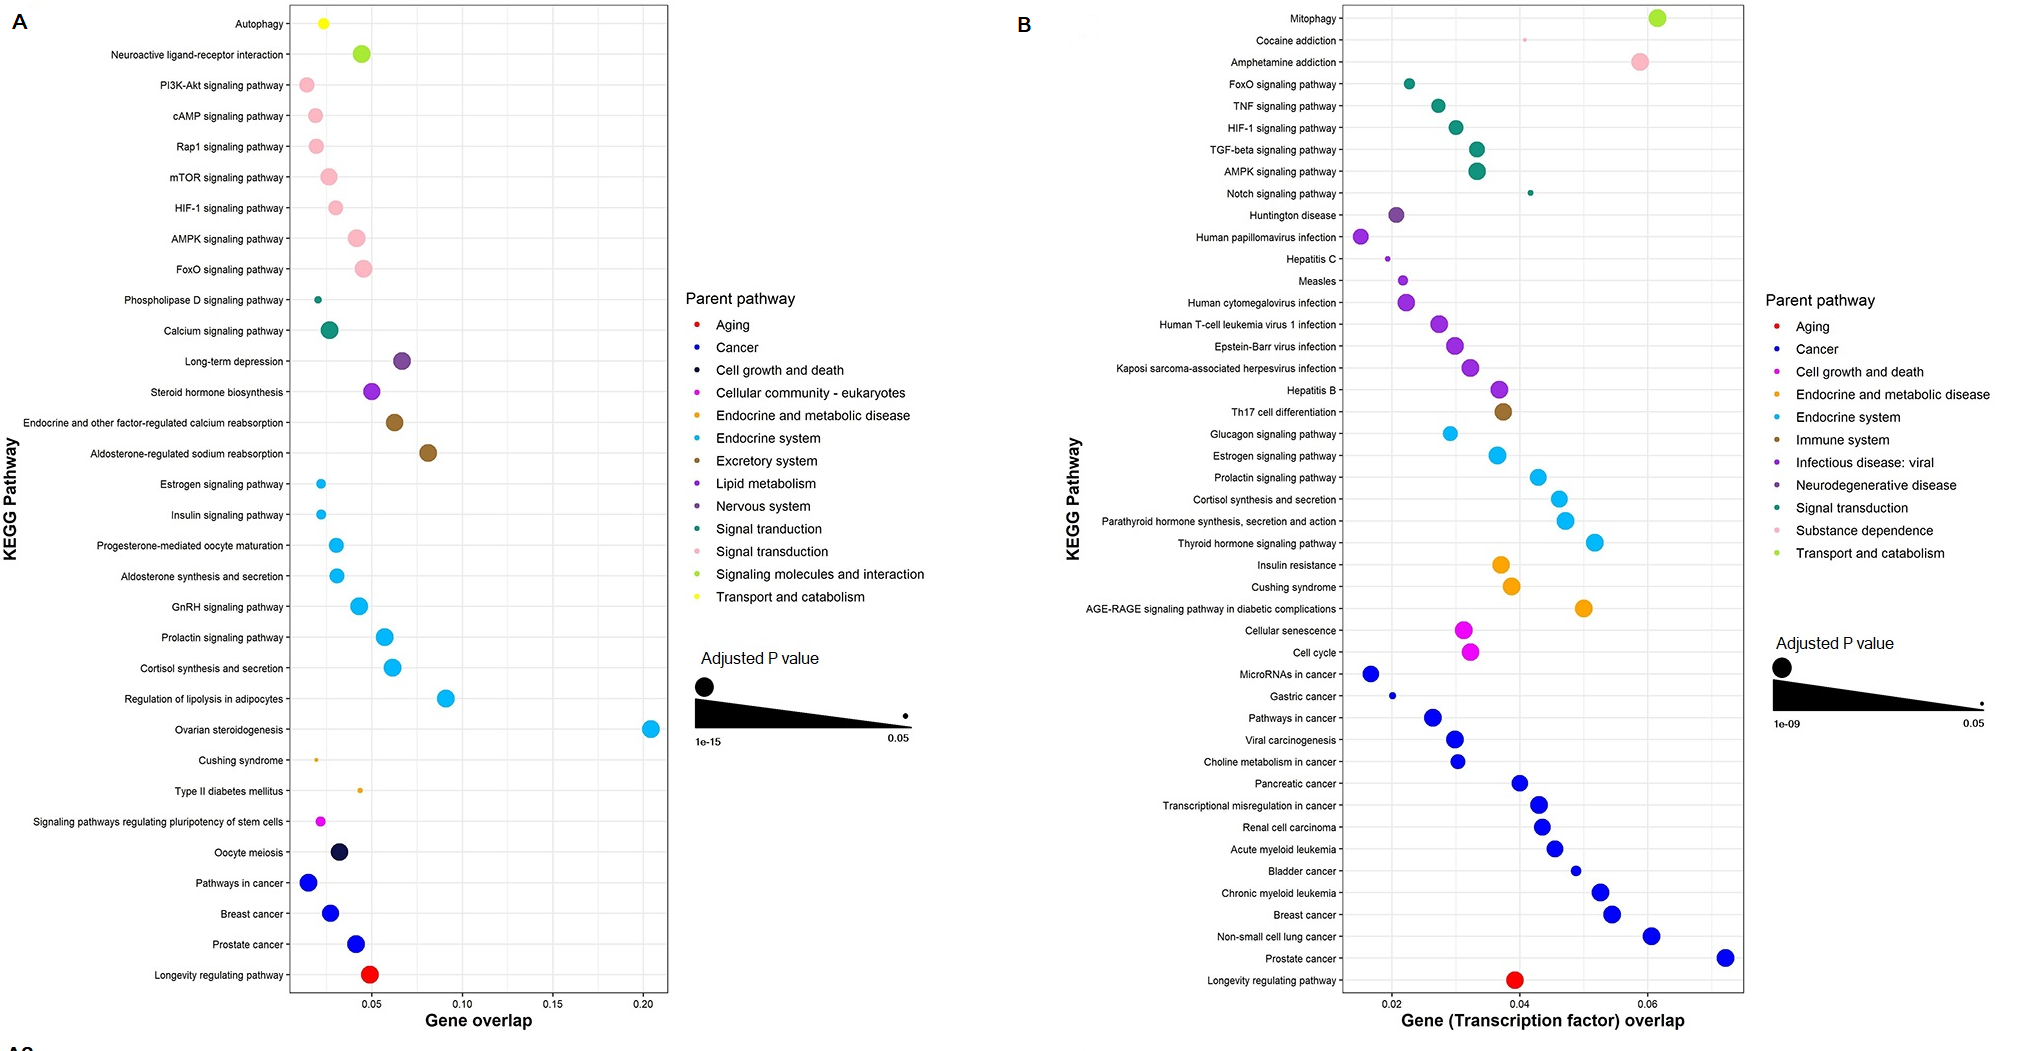 Bubble plot illustration of KEGG pathways enriched in (A) PrecocityDB gene-set and (B) transcription factors of PrecocityDB gene-set. The x-axis represents gene overlap score (provided by GS2D) and y-axis indicates enriched pathway terms. Bubble size is proportional to P value of enriched pathways. Bubble color represents parent pathway term. |
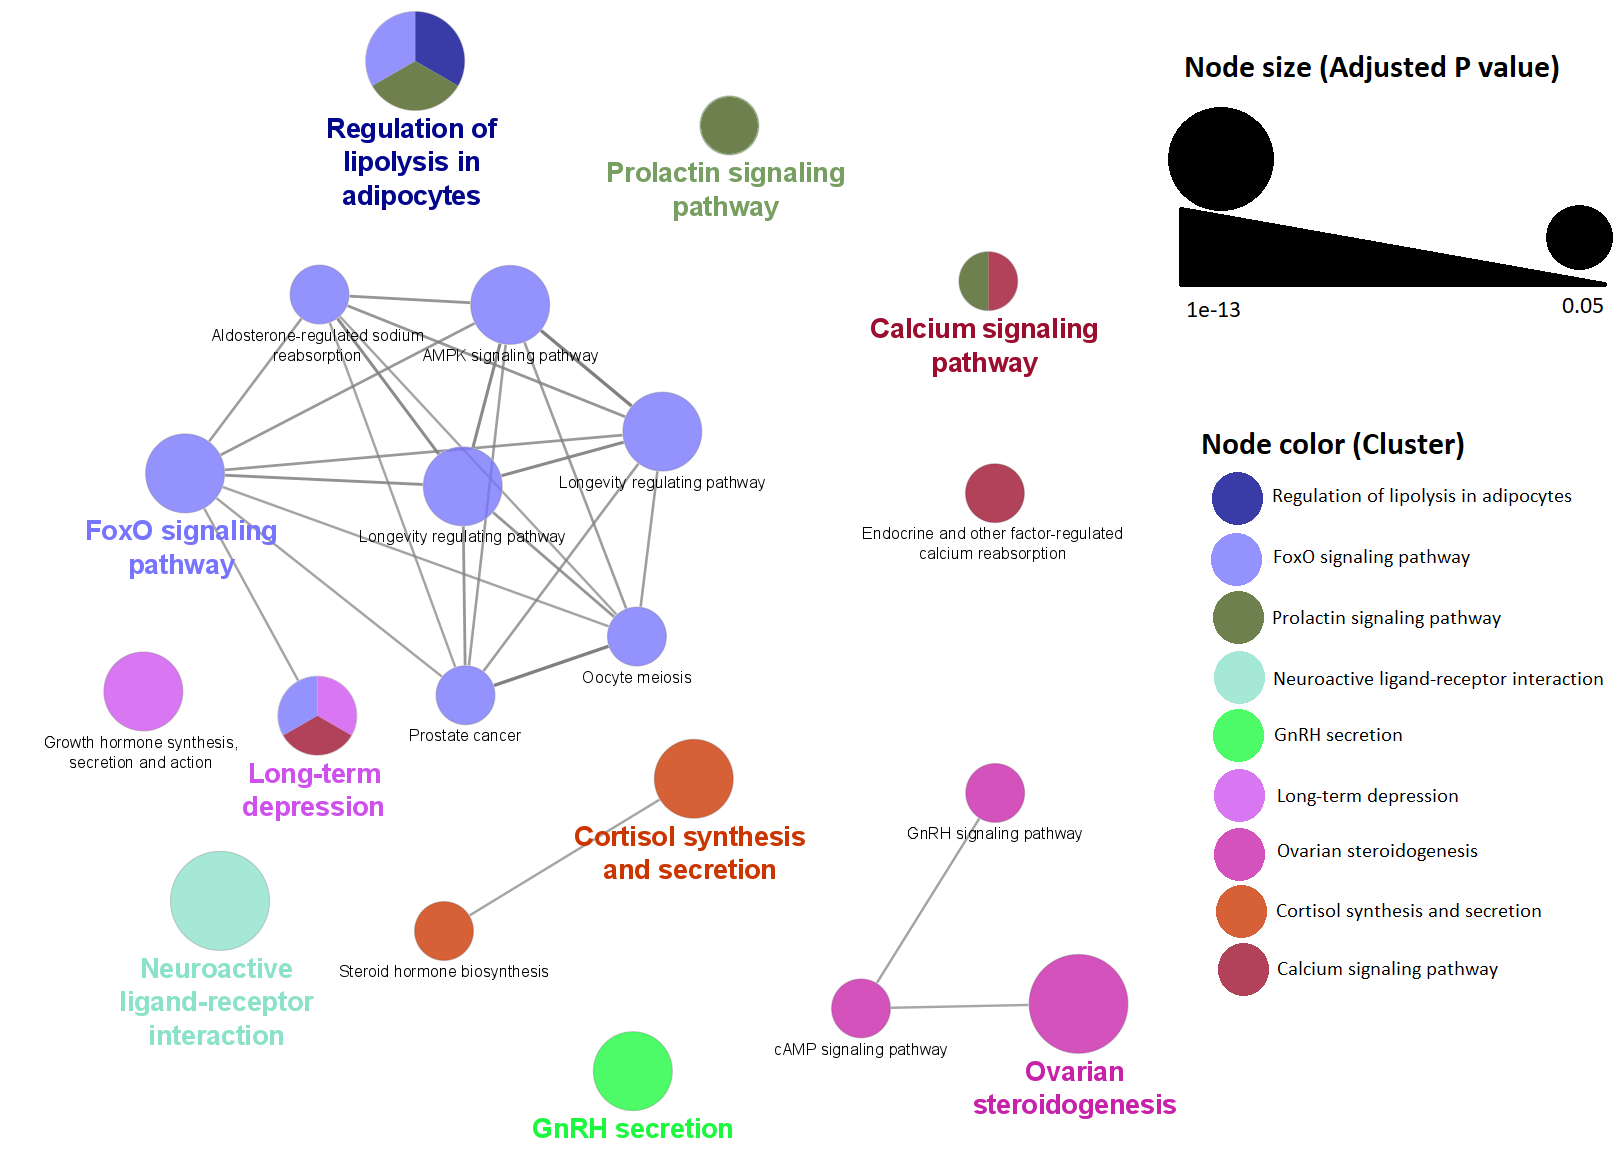 Clustering analysis of enriched pathways using PrecocityDB gene-set. Node size is proportional to P value. Edge represents at least one gene shared between two connecting nodes. Nodes within a cluster are colored based on the most significant pathway term (labelled in same color). |
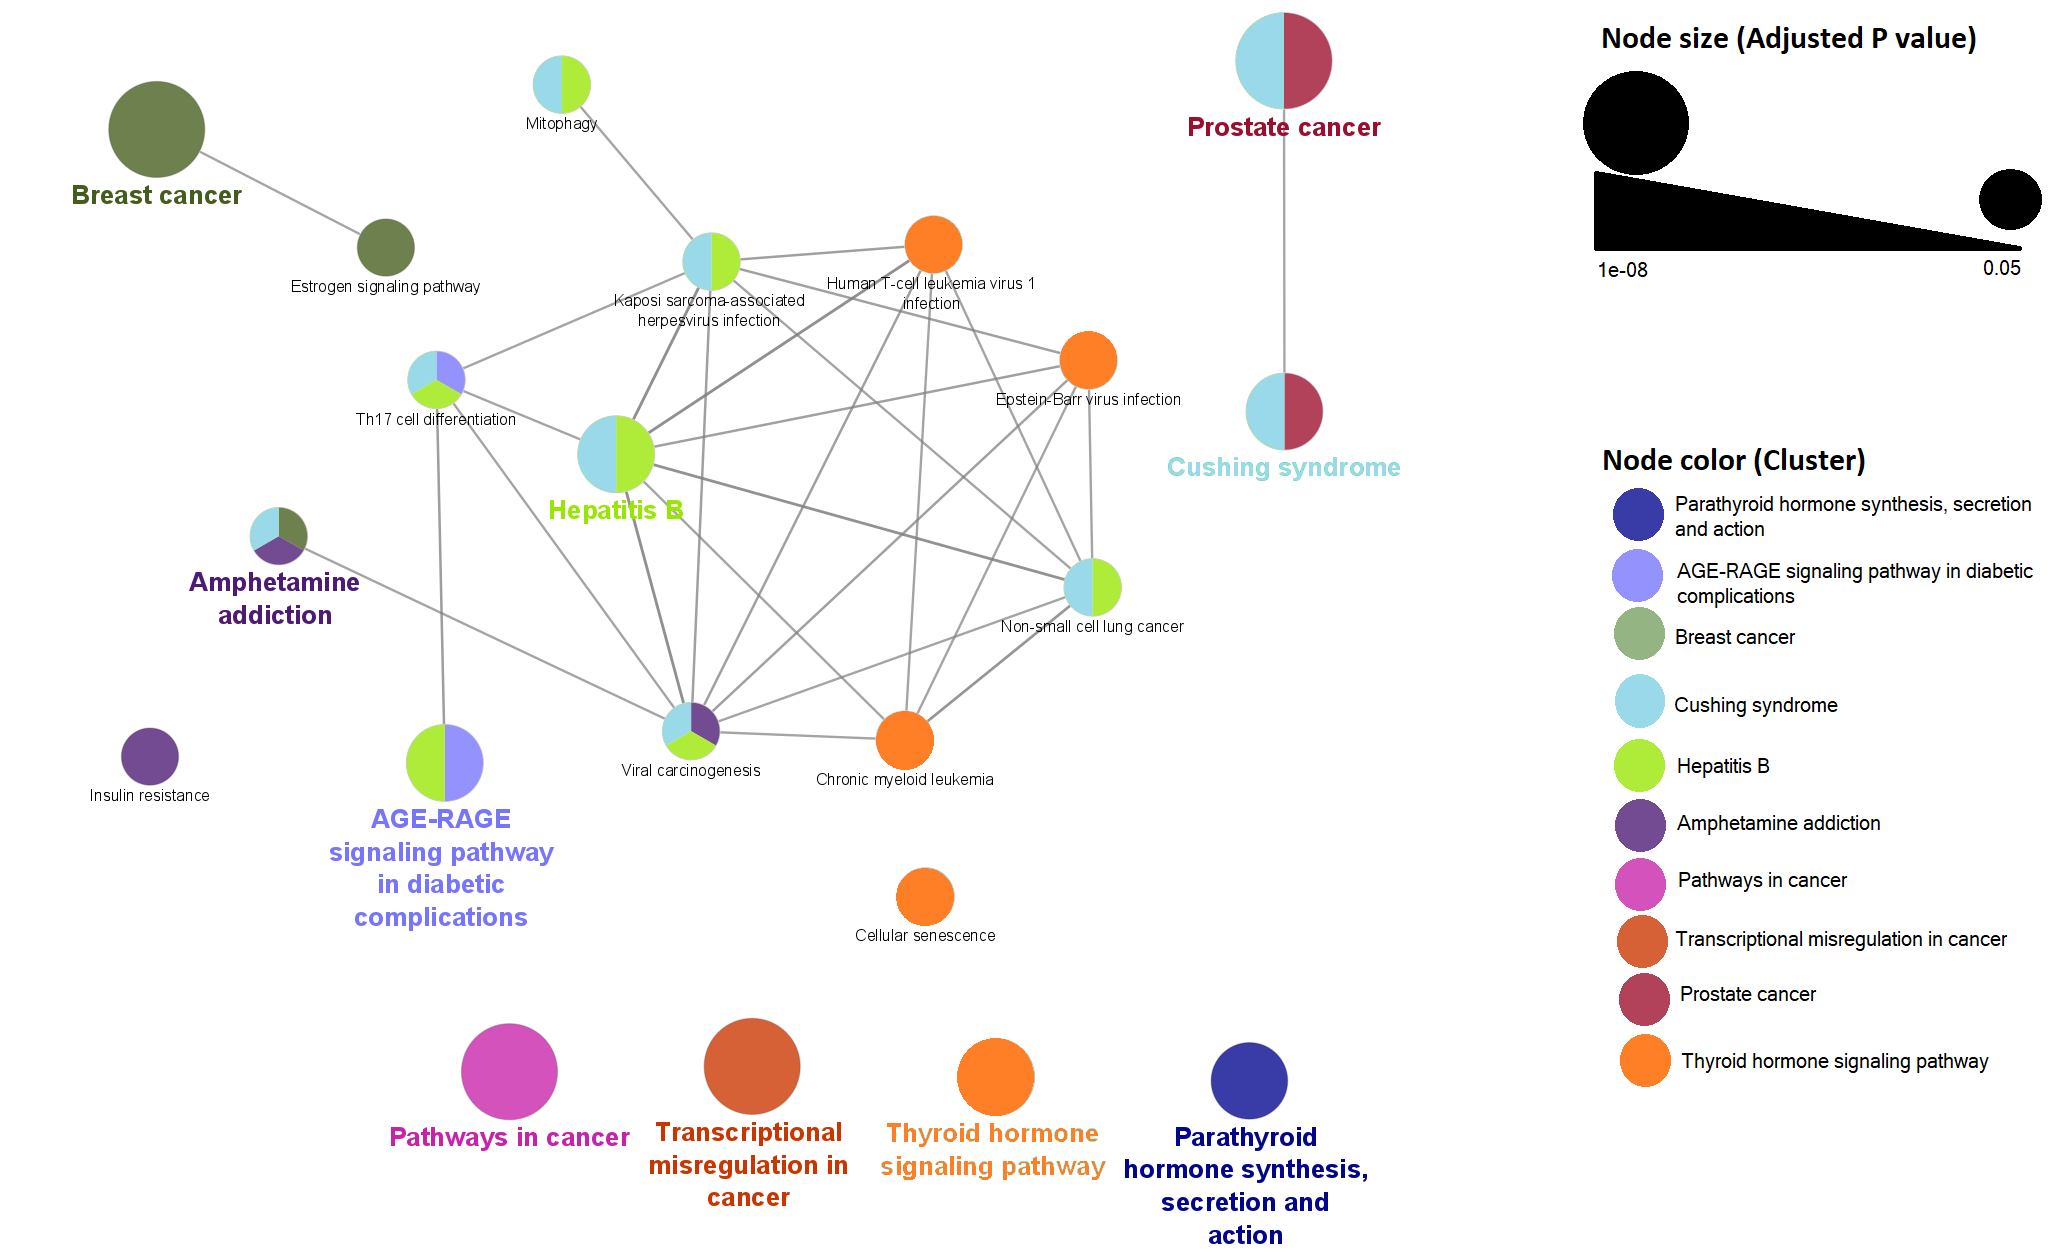
Clustering analysis of enriched pathways using transcription factors of PrecocityDB gene-set. Node size is proportional to P value. Edge represents at least one gene shared between two connecting nodes. Nodes within a cluster are colored based on the most significant pathway term (labelled in same color). |